Elizabeth Meza
Fellow, Community Colleges
An Update on Enrollment, Completion, and Labor Market Outcomes

Nearly 20 years ago, Washington State wanted to provide opportunity to students and serve local employers by increasing the number of bachelorŌĆÖs degree graduates. State leaders developed policy changes and programs, and one innovation authorized community colleges to offer applied bachelorŌĆÖs degree programs. These programs were designed to increase educational pathways, particularly for professional and technical associate graduates, people of color, older working adults, and those whose family responsibilities root them in place. This brief uses data from the Washington State Board for Community and Technical Colleges (SBCTC) to explore the academic and labor market experiences of community college baccalaureate (CCB) students and graduates. CCB programs seem to be meeting the needs of this student population by opening opportunities to the baccalaureate degree in careers with strong labor market demand.
Students in CCB programs are older, on average, than students who transferred from a community college to a university, with a large number of students over 40. Almost half of CCB students receive need-based financial aid,[1] a higher percentage than in career and technical programs in community colleges or in the public university system in Washington. We found students at rural-serving community colleges are even more likely to be receiving financial aid than their counterparts at other community and technical colleges (CTCs). And while all CCB students skew female, that is even more true for students in rural-serving community colleges.
Seventy percent of CCB students completed the baccalaureate degree within four years of enrolling, compared to of transfer students entering a public four-year college or university.
After obtaining a baccalaureate degree from a community college, 83 percent of students were employed with a median annual wage of $68,000.
Although the value of higher education has been questioned lately, research shows itŌĆÖs still the cost and effort. The Georgetown Center on Education and the Workforce that while 36 percent of jobs in the United States required at least a bachelorŌĆÖs degree in 2021, as many as 42 percent of jobs would require this level of education by 2031. While bachelorŌĆÖs degrees open economic doors in communities across the country, holding a degree at this level appears particularly important in Washington. The Evergreen State 15th by the share of jobs requiring a bachelorŌĆÖs degree and 14th by the share of jobs requiring a graduate degree. However, bachelorŌĆÖs degree attainment in Washington is inequitable and varies considerably by race and ethnicity. While of white state residents hold at least a bachelorŌĆÖs degree, only 28 percent of Black and 20 percent of Latine Washingtonians do.
An increasing number of statesŌĆöincluding WashingtonŌĆöhave introduced and expanded the authority for community colleges to confer bachelorŌĆÖs degrees in applied fields, with and a few more actively considering authorization. In 2022, over students earned a bachelorŌĆÖs degree at a community college.
As conferral authority expands to new states and institutions, state policymakers and practitioners need more information about who enrolls in these programs and why, and what happens to graduates in the labor market. Understanding these patterns informs the extent to which these degrees serve a population that may not otherwise obtain a bachelorŌĆÖs degree, especially racially minoritized students, older adult students, and those in rural areas. Because these degrees are most often offered in high-demand and applied fields, it is important to know to what extent they provide ŌĆ£ŌĆØ to graduates.
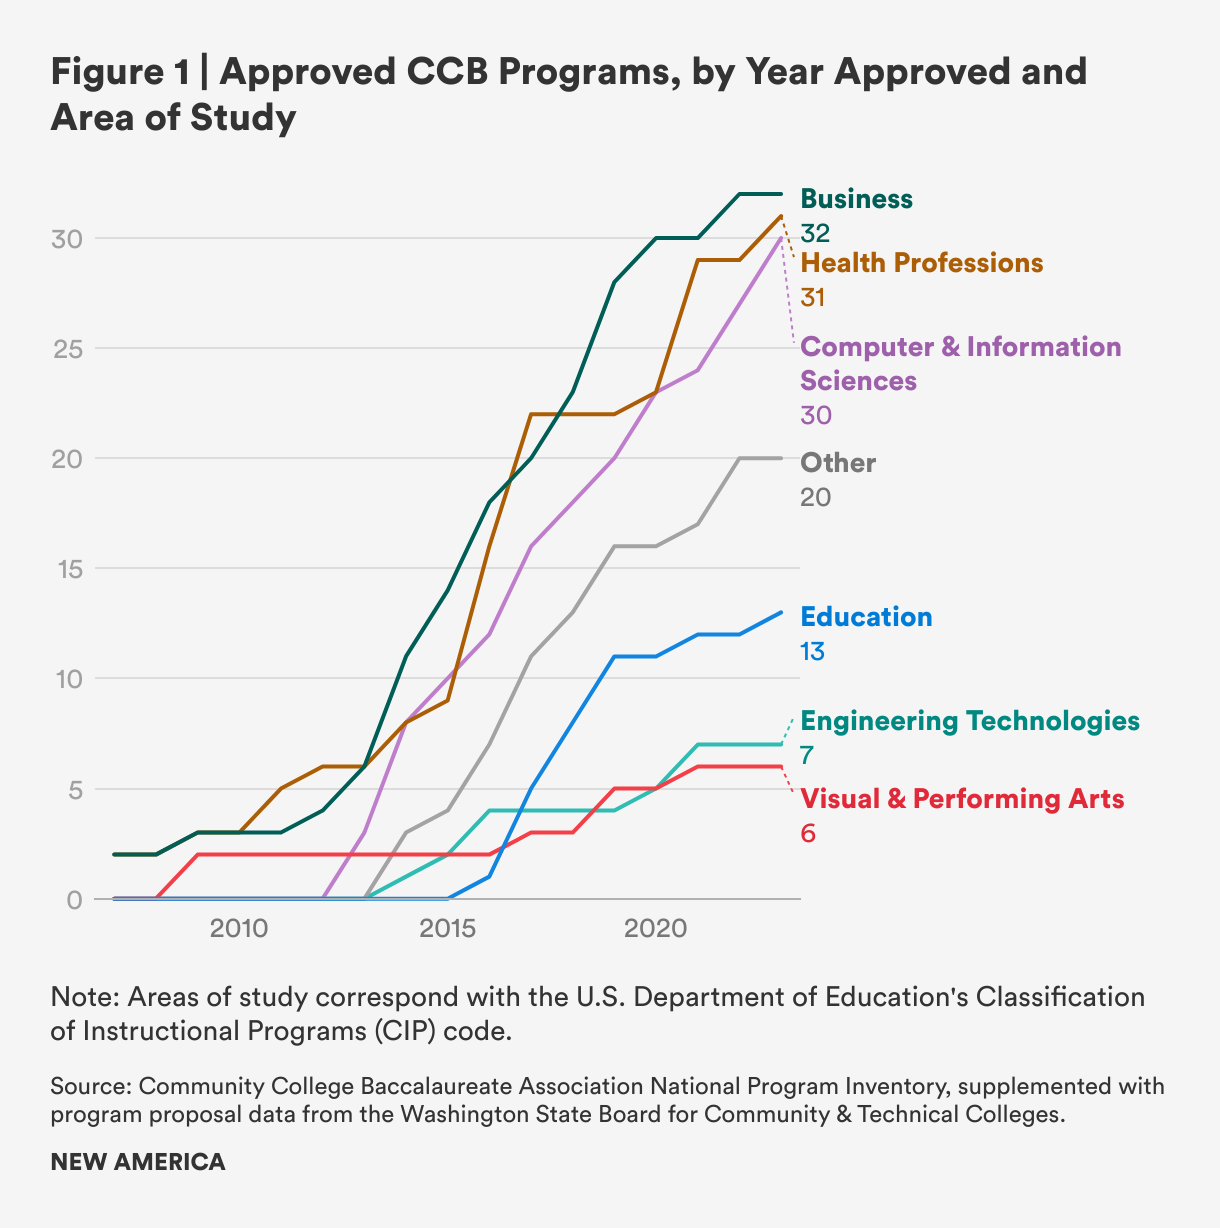
Washington is one of only two states (Florida is the other) where these degrees have expanded to every community and technical college. The from the Community College Baccalaureate Association shows 144 CCB programs in Washington. While some colleges offer up to 14 degrees, others offer only one or two. Figure 1 shows the growth in programs in Washington. Recently, the state legislature of community and technical colleges (CTCs) to offer Bachelor of Science degrees in computer science. Support from local businesses played a in this change. This legislation deepened the stateŌĆÖs commitment and scope of CCBs at community colleges.
The history and scale in Washington allow us sufficient numbers to analyze student enrollments and outcomes and to illuminate the value of these programs. This brief follows a number of other ╣·▓·╩ėŲĄ briefs examining the demographics and labor market outcomes of community college baccalaureate graduates. The purpose of this brief is to describe who enrolls and graduates from CCB programs in terms of demographics, rurality, and area of study; to illuminate earnings of CCB graduates by demographics and program area; and to examine any changes from research that was done pre-pandemic.
To address these questions, we requested data from the Washington State Board for Community and Technical Colleges (SBCTC) and accessed dashboards through a data-sharing agreement between the University of Washington and the SBCTC. The five most recent enrollment cohorts (2018ŌĆō2022) provide enrollment information. Data for labor market outcomes are from the most recent cohort: students who enrolled in a CCB program in 2019 and graduated within three years. Where appropriate, I also contextualize and compare some of the measures presented and use other publicly available sources (e.g., Washington Education Research and Data Center dashboards, Integrated Postsecondary Education Data System, and others).
After a peak enrollment in 2020, CCB enrollment in Washington dropped in concert with community college enrollment nationwide during the COVID-19 pandemic. There was a slight rebound in 2022, the most recent year data are available. The percentage of students in CCB programs receiving need-based [2] aid is higher than all CTC students in Washington. In 2022, the share of CCB students receiving need-based aid was 48.5 percent. This figure is higher than the 36.3 percent of total students in the community college system who received need-based financial aid in the 2022 academic year,[3] and the 36.6 percent of students who received need-based aid in the public four-year system.[4] This finding is similar to previous findings in Washington that CCB students are more likely to receive financial aid than students in the CTC workforce or transfer programs, and suggests that CCB students may have more financial need than their counterparts in the CTC or four-year system.
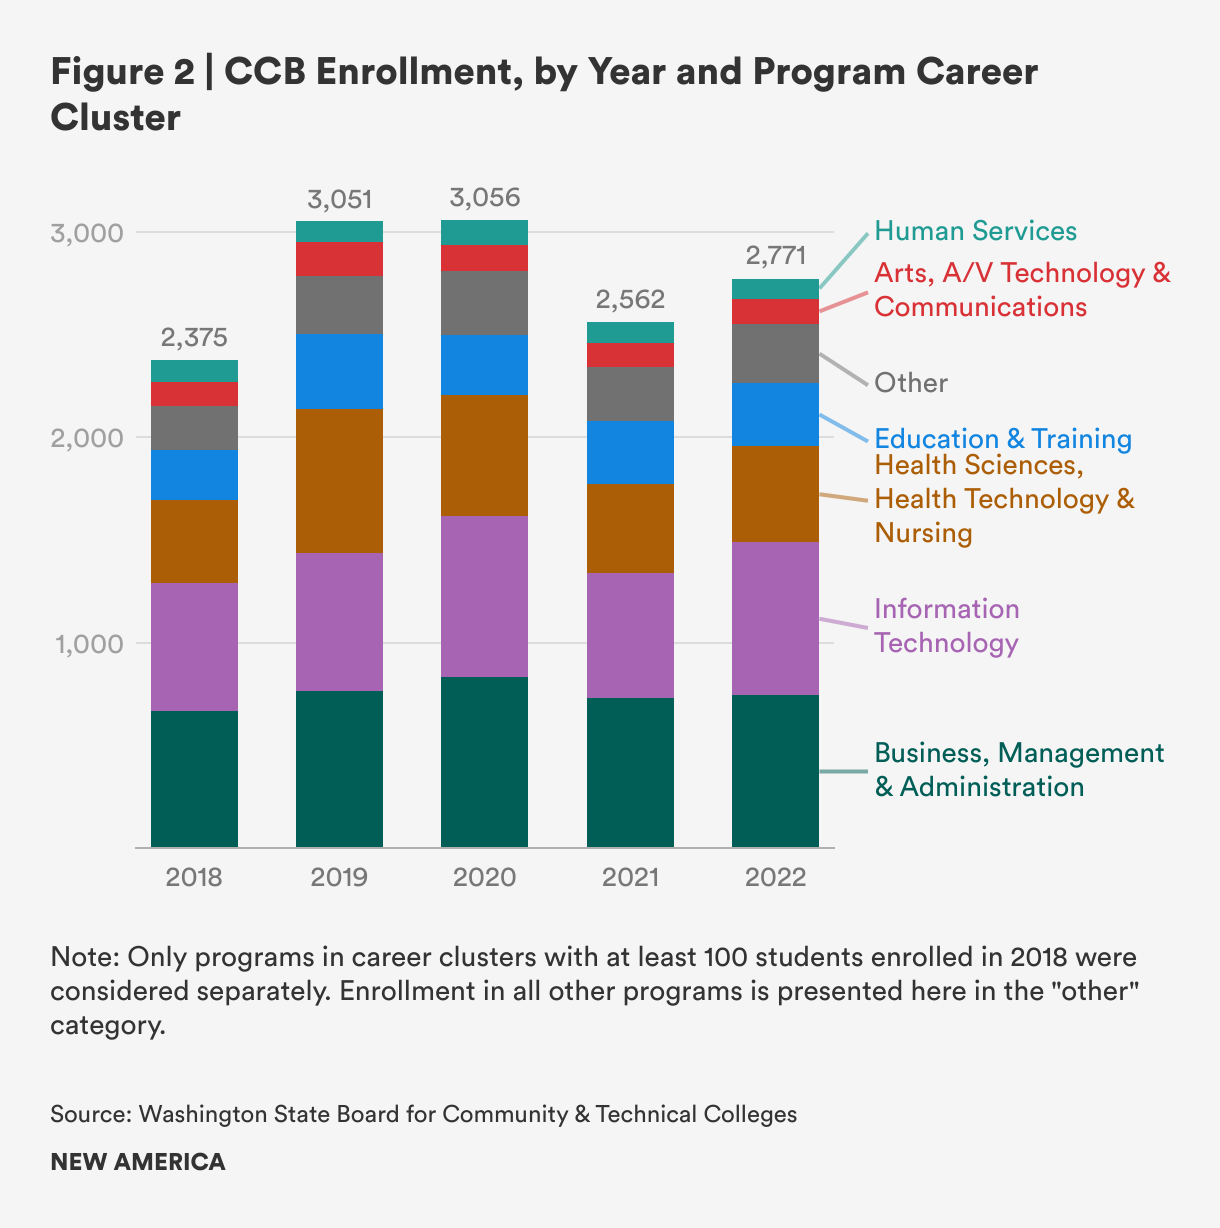
Enrollment in CCB programs has not rebounded from its peak enrollment in 2019 or 2020, but some career clusters have increased their percentages of the total.[5] For example, in 2022, we see both information technology and education and training with higher percentages of the total enrollment than they had in previous years. These two areas lead directly to occupations, which suggests that as enrollment recovers, students are drawn to degree programs with an emphasis on applied skills with a direct path to careers. Figure 2 shows enrollment patterns for all available years of data, disaggregated by area of study.
CCB programs in Washington are enrolling a slightly more racially and ethnically diverse population than four-year institutions in Washington. Figure 3 shows the racial and ethnic breakdown of students in CCB programs.
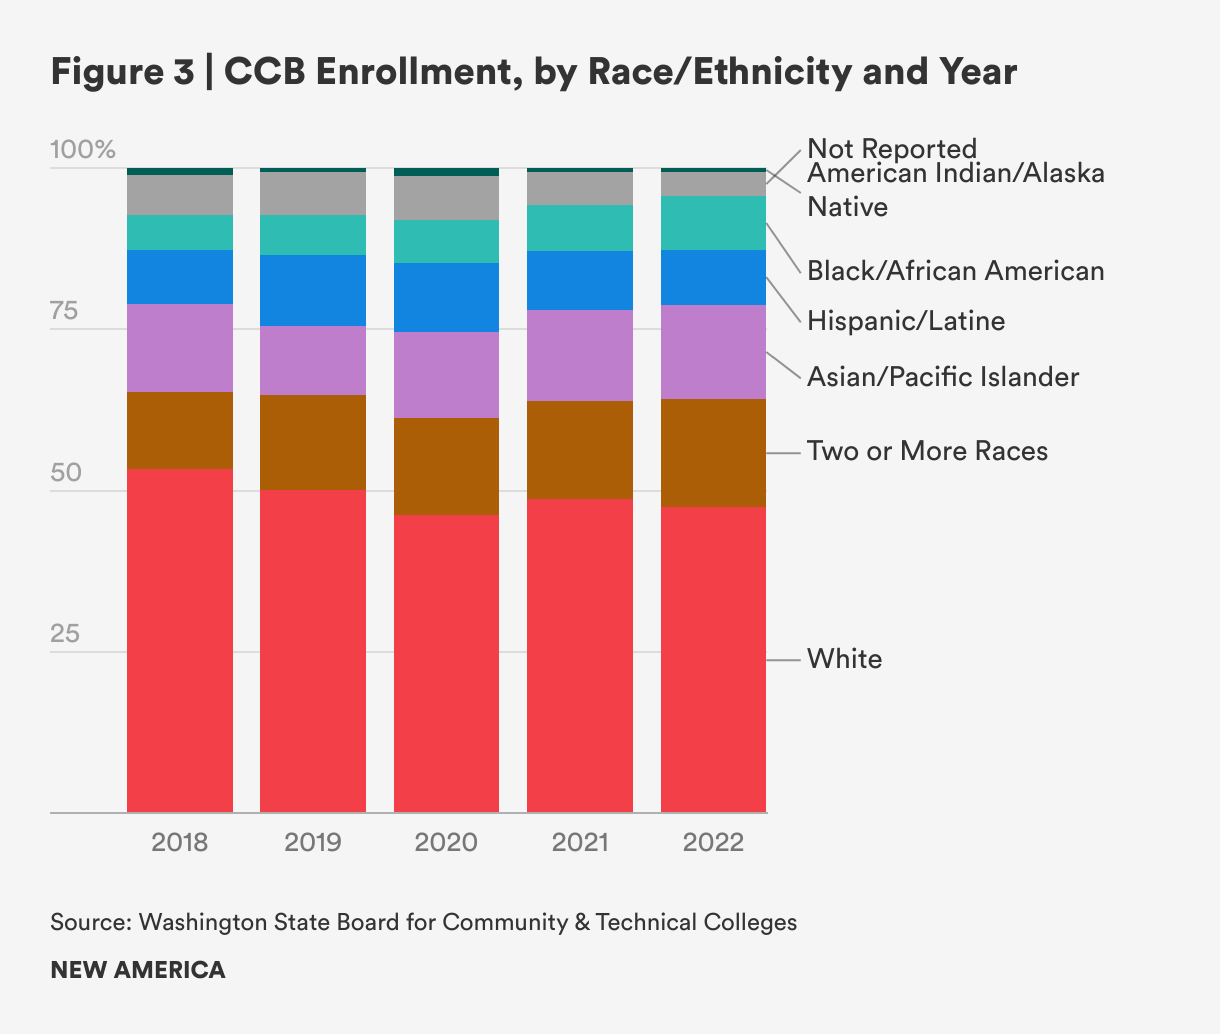
The percentage of historically underserved students of color has grown steadily for the last five years in Washington CCB programs.[6] The population of historically underserved students has grown from 23.3 percent of students in 2018 to 32.4 percent of students in 2022. Black/African American students grew as a percentage of the total, as did Asian/Pacific Islander students and students of two or more races. White students and Hispanic/Latine students have declined as a percentage of the total population of CCB students, but it is not possible to explain why this decline took place with the data used for this analysis; future research should examine why this is.
Still, the CCB population is more racially and ethnically diverse than public university students in Washington. For comparison, students in historically underrepresented groupsŌĆödefined as Black, Hispanic/Latine, and American Indian/Alaska NativeŌĆömade up only 18 percent of undergraduate enrollment in in 2021ŌĆō2022. has found CCB graduates to be more racially and ethnically diverse than graduates in similar programs in four-year institutions. Continuing to track the diversity of CCB programs is important to see if they are delivering on their promise and potential to provide a pathway to the baccalaureate degree for racially minoritized populations.
Figure 4 shows the gender breakdown of CCB programs. As a percentage of the total, we see the percentage of male students growing slightly each year from 2019 to 2022, but still not back to their high of 42.8 percent in 2018.
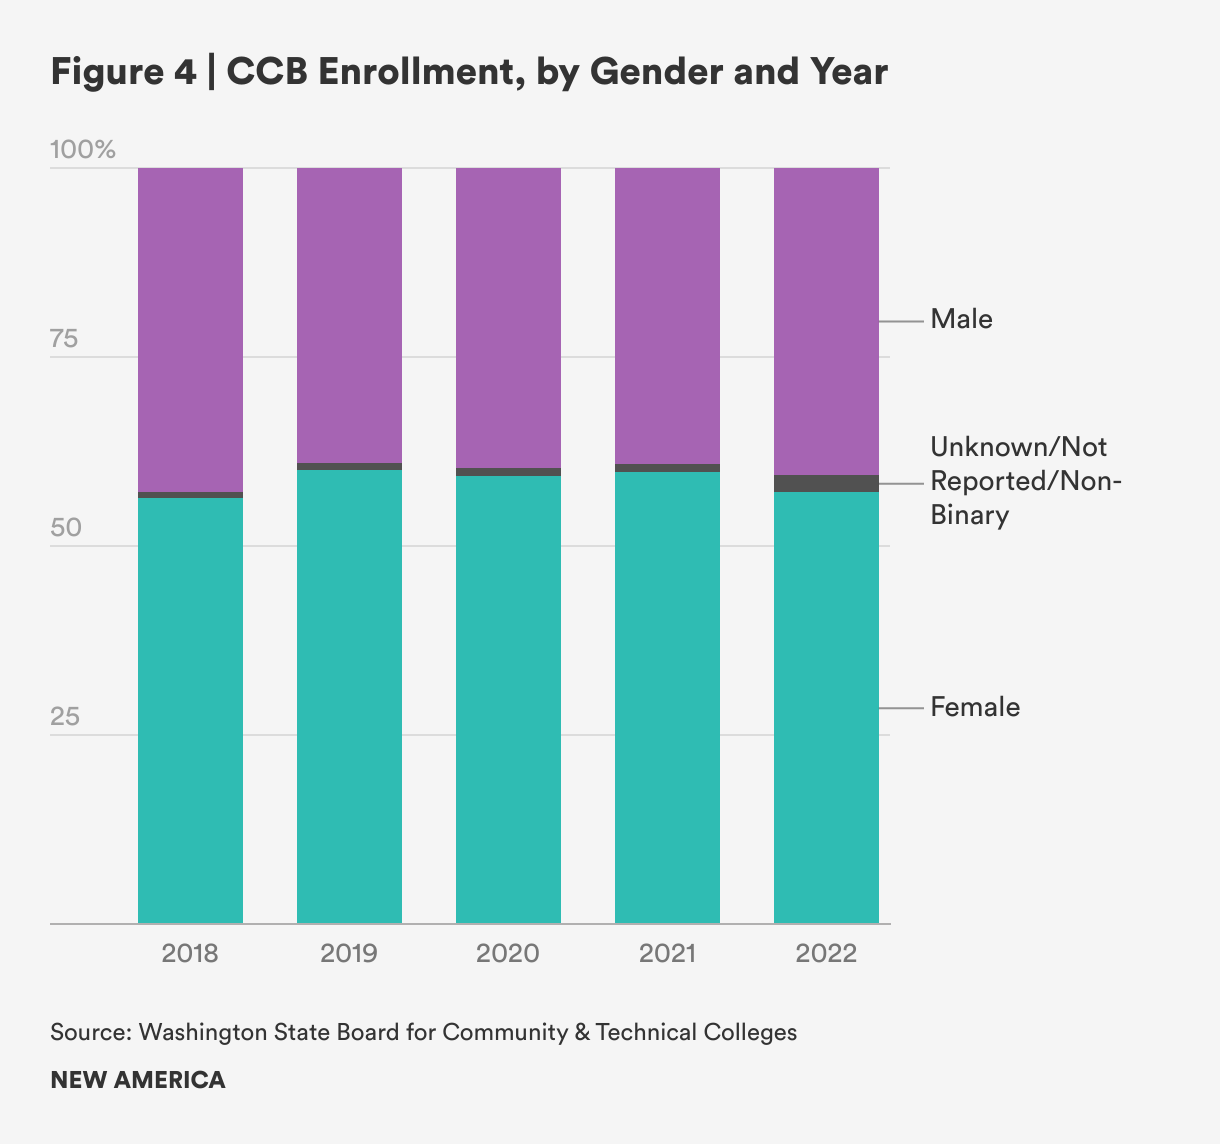
We know that so this may reflect the program mix in a given year. For example, in 2022 the Bachelor of Science in computer science was launched at several colleges, increasing the enrollment of a predominately male cohort of students. Nationally, despite earning of total bachelorŌĆÖs degrees, women earned only of bachelorŌĆÖs degrees in science, technology, engineering, and mathematics (STEM) fields in 2021ŌĆō2022. Not all CCB programs are in STEM fields, to be sure. Yet, the applied and technical nature of many of these programs provides a path for more women to earn STEM bachelorŌĆÖs degrees when colleges try to recruit students across racial/ethnic and gender groups.
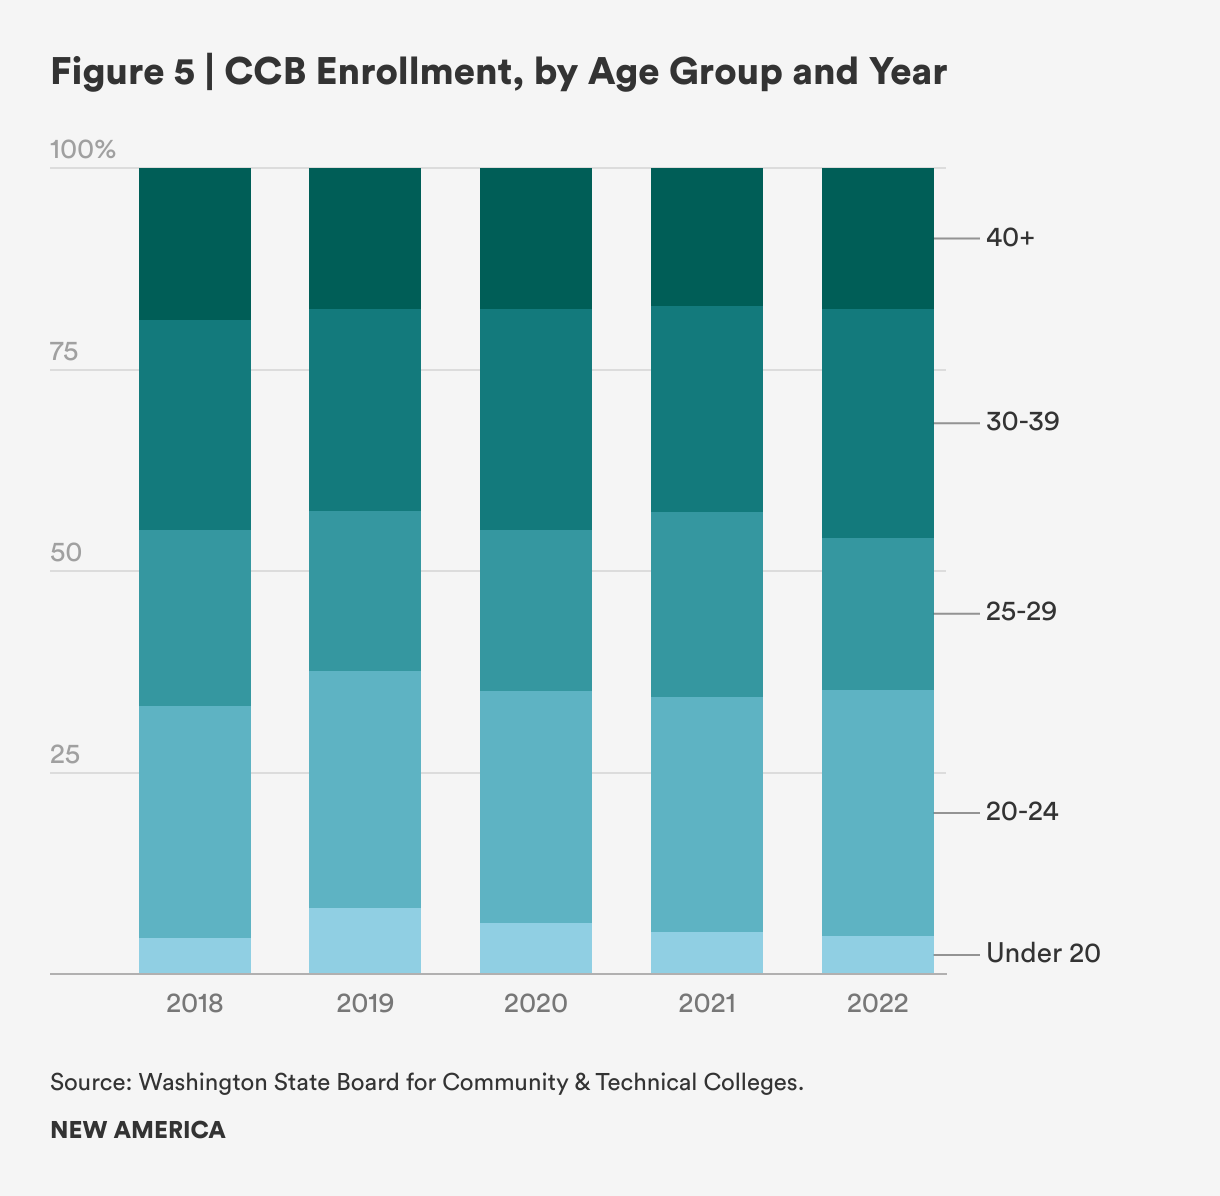
As shown in Figure 5 nearly half of CCB students are age 30 or older. We found that students in Washington CCB programs are older than transfer students nationwide.[7] Students 40 or older when they entered a CCB program reflect a steady trend in terms of overall percentage of CCB students in Washington, close to 18 percent. This contrasts with the 8.2 percent of transfer students nationwide who are over 40. In fact, the National Student Clearinghouse Research Center that 63.6 percent of transfer students are 24 or younger, compared to only 35.2 percent of CCB students in Washington. In , I found the average age of CCB students to be 32, which held true in this analysis as well. The largest group of students (30.5 percent in 2022) were students who entered a CCB program at age 20ŌĆō24, followed closely by students aged 30ŌĆō39 (28.3 percent). In the last few years, students under 20 enrolled in CCB programs, likely after earning credits through dual enrollment, declined with numbers and percentage shrinking since a peak in 2019. These findings suggest that CCB students are a distinct group by age and that CCB programs are serving an emerging group of adult learners in a way that traditional transfer may not be.
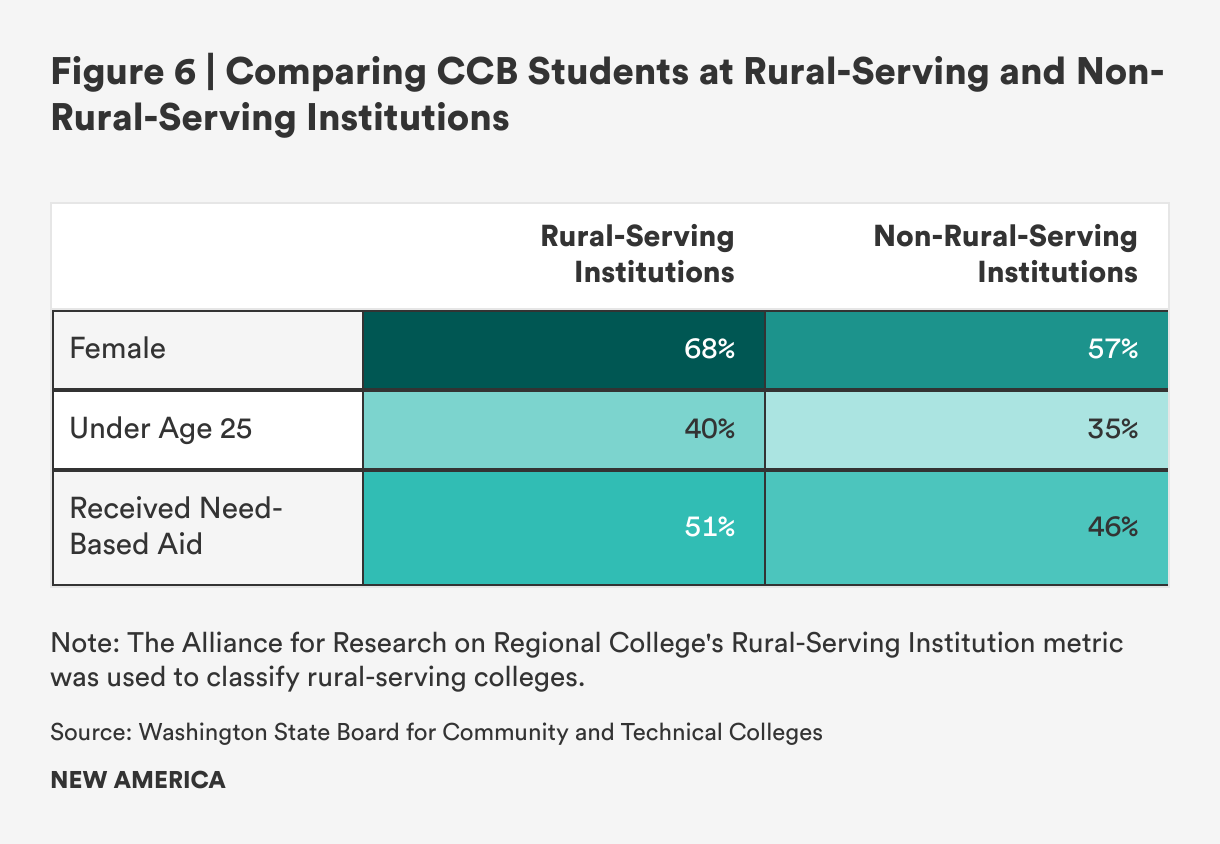
Using the developed by the Alliance for Research on Regional Colleges, I identified rural-serving institutions in Washington and compared their student data against non-rural-serving institutions.[8] There were several interesting differences between students at rural and non-rural-serving CCB institutions in Washington. First, the proportion of female students is greater at rural-serving colleges, where 68 percent of CCB students are female compared to 57 percent in the entire CCB population. This may be due to the types of programs offered at rural-serving colleges (e.g., health care); they might attract more female students. Second, CCB students at rural-serving colleges were younger than in the state as a whole. At rural-serving colleges, 40 percent of CCB students were under age 25, compared to 35 percent statewide, suggesting that CCBs may be opening up the opportunity for younger students who want to pursue a bachelorŌĆÖs degree close to home. Finally, 51 percent of CCB students at rural-serving colleges received need-based aid, compared to the 46 percent of students at non-rural-serving institutions that received this aid.[9] Taken together, these differences seem to point out a slightly different population at rural-serving institutions than at suburban and urban institutions. Figure 6 below shows these differences.
Of students who enrolled in a Washington CCB in 2018, 70 percent had completed their program within four years. This compares to a 72 percent bachelorŌĆÖs degree completion rate for students who transferred to one of the stateŌĆÖs public four-year universities. However, it is important to note that students in CCB programs face more challenges that have been associated, in , with lower competition rates. CCB students tend to be older, often have dependents, receive need-based financial aid, and are more likely to be than bachelorŌĆÖs degree students at public four-year universities. That completion rates for CCB students are nearly equal to those of students who transferred to a university is promising.
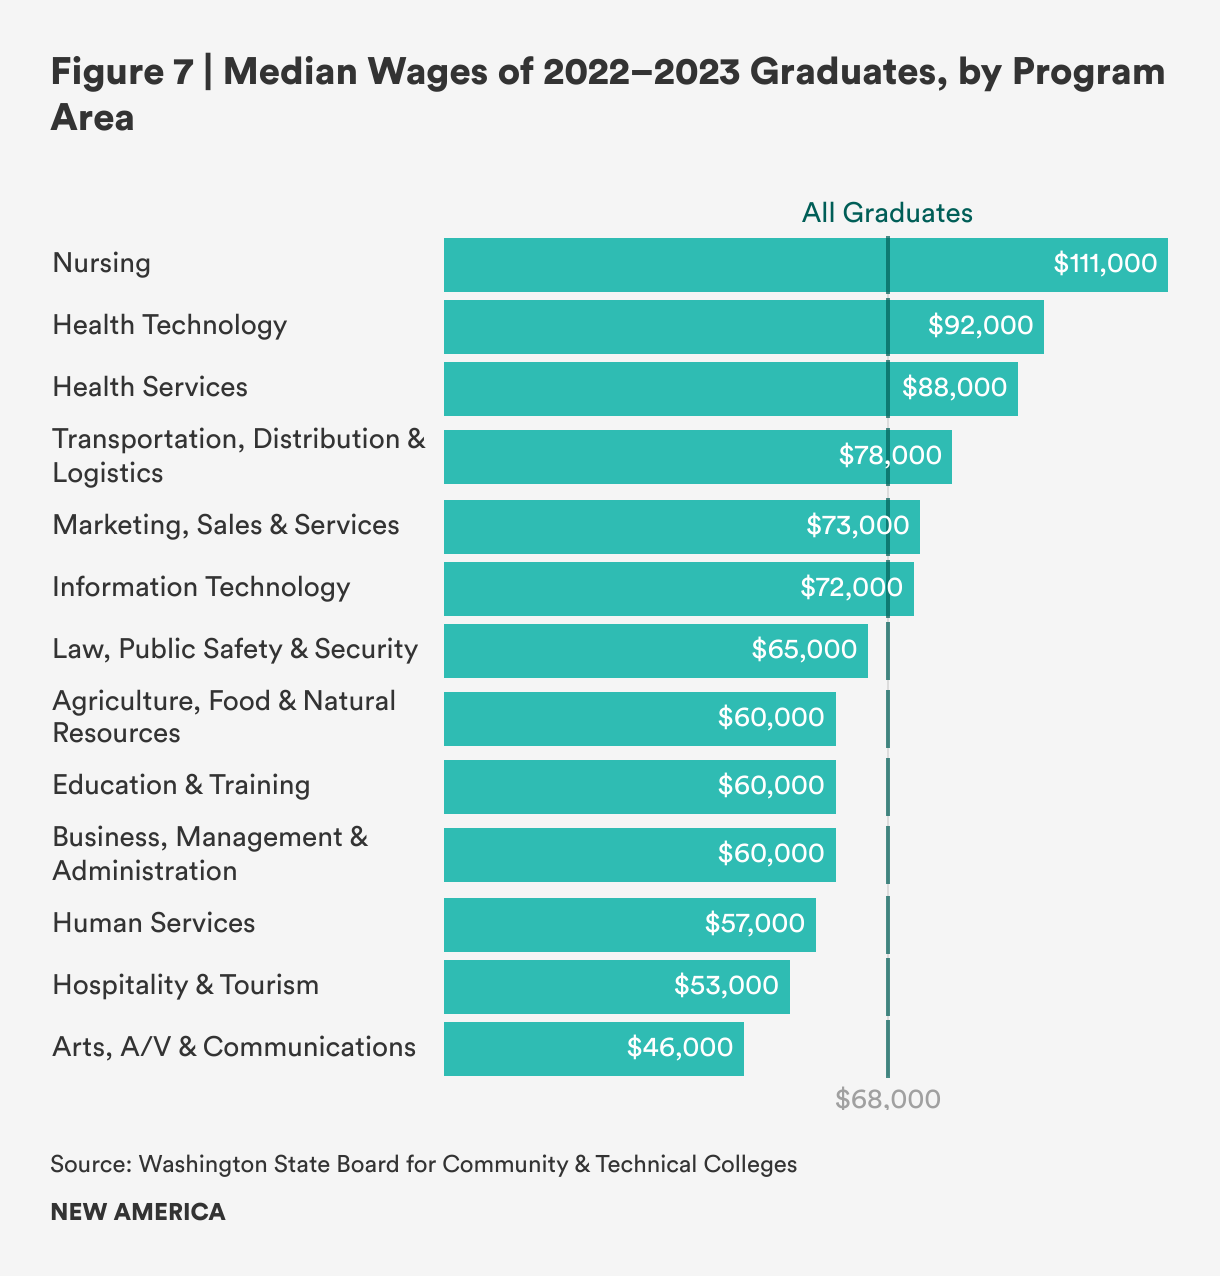
Access to local and affordable bachelorŌĆÖs degree programs is critical, as is a reasonable likelihood of program completion. Because CCB programs are designed to align with local labor market needs, strong wage outcomes are also essential. As detailed in Figure 7, the median wage for 2019 CCB graduates soon after graduating from a CCB program was $68,000.[10] Students who entered a CCB program in 2018 saw wages increase from $65,000 after graduation to $72,000 one year later, suggesting that the baccalaureate degree was boosting their earnings. A recent study found the median early career salary for all baccalaureate graduates in Washington to be . Because CCB graduates are older and likely to have more workforce experience than recent graduates of university bachelorŌĆÖs programs, it makes sense that CCB graduates would earn more at the outset than the average recent bachelorŌĆÖs program graduate.
The finding that CCB graduates earn more than the average new bachelorŌĆÖs degree holder in Washington may help address worries about whether CCB programs provide graduates the same economic outcomes as more traditional bachelorŌĆÖs programs at universities. The Georgetown University Center on Education and the Workforce defines a as one that paid at least $39,785 for workers under age 45 as of 2021, far less than what the average CCB graduate was earning after graduation. Taking into account that these earnings reflect both full-time and part-time employment, the returns on CCB degrees appear impressive.
Overall wages for CCB graduates were strong, though wages shortly after graduation varied by program area. Graduates in the hospitality and tourism cluster had the lowest wages. Nursing graduates had the highest wages, nearly $20,000 higher than the next highest career cluster. Health technology and health services students also showed high wages. has shown that CCB graduates earn comparable, or slightly higher, wages to their peers who graduated in similar programs from a four-year university.
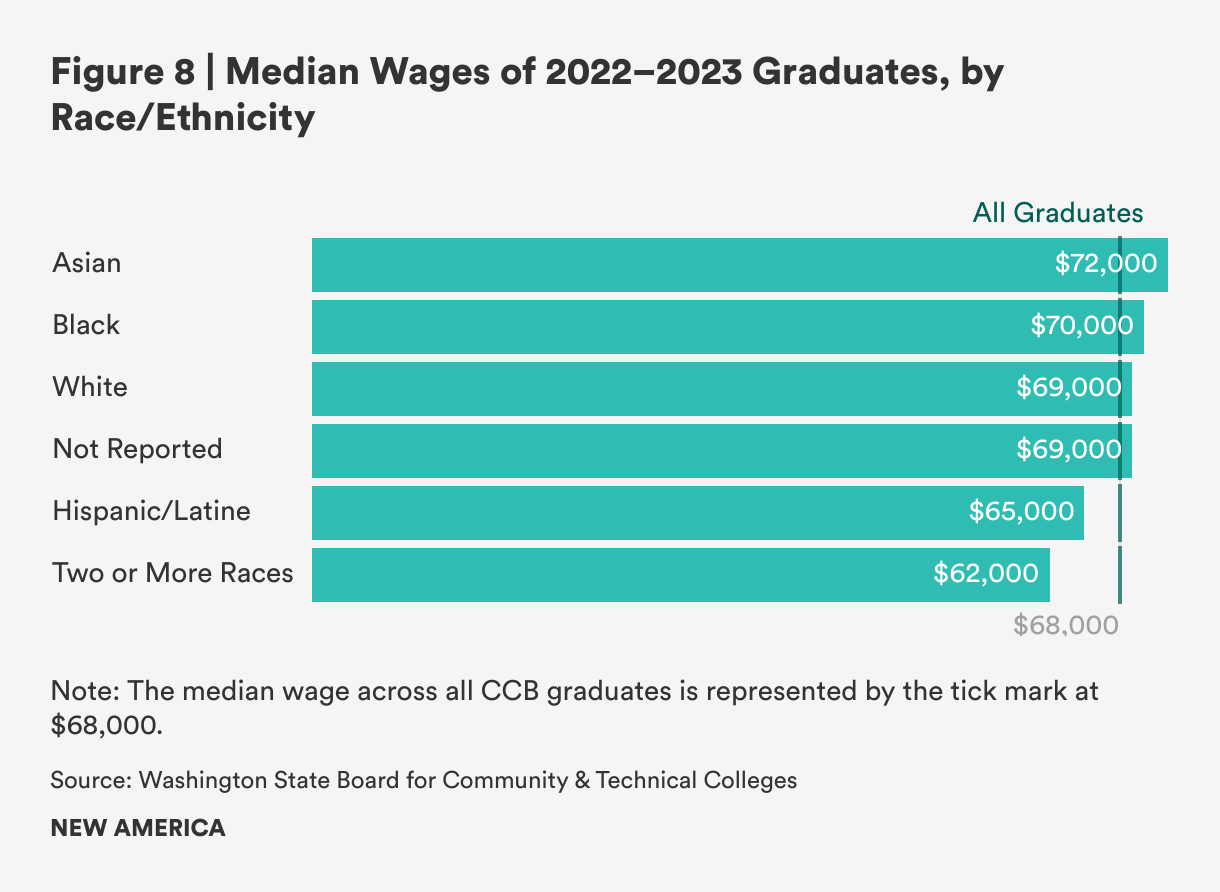
There were some race related differences in wages for CCB graduates as shown in Figure 8. Asian graduates saw the highest median wages, with students of two or more races receiving the lowest median wages.
CCBs are one strategy in a suite of new models aimed to disrupt higher education and allow more students, and different students, access to degrees that allow for improved personal and community outcomes. CCB degrees in Washington provide access to the baccalaureate degree for older students, rural students, and racially minoritized students: in short, a path forward for those who might not otherwise have this opportunity. Completion rates are strong. There is employer demand for these graduates, shown in high employment rates and wages, particularly in health care and information technology.
While these CCB results are promising, there are a number of research questions that remain unanswered. In particular, we should investigate the pathways that students take into these degrees. Little is known about the previous educational experiences of CCB students and the extent to which they represent a traditional transfer population or have experiences that are best served by a CCB degree. States and researchers should continue to disaggregate and monitor the demographics and life experiences of CCB students to ensure that access and opportunity is provided equitably, and they should investigate any demographic changes in enrollment. Washington has an abundance of information on CCB degrees because the state has invested in a relatively robust and transparent data system. Other states should follow suit.
Finally, there is limited information on how to sustainably and equitably implement CCB degrees that reflect student and employer demand. Without good information, examples, and data-sharing on how to develop and implement these degrees, they will not meet their potential to provide additional access to the baccalaureate.
Thank you to Ivy Love, Iris Palmer, Mary Alice McCarthy, Sabrina Detlef, and the entire communications team at ╣·▓·╩ėŲĄ. Thank you to Summer Kenesson, Diana Knight, and Val Sundby at the Washington SBCTC and Debra D. Bragg of Bragg & Associates. Thank you to Sue Cui and Kirsten Yeado at Ascendium Education Group.
[1] Students receiving a Pell Grant or .
[2] Defined as either receiving a Pell Grant or the Washington College Grant.
[3] .
[4] Washington State Education Research Data Center statewide .
[5] In this dataset, Washington uses the developed by Advance CTE to group programs.
[6] The SBCTC designates Hispanic, Black, and American Indian/Alaska Native students as ŌĆ£historically underrepresentedŌĆØ and measures this group in aggregate in a separate data field.
[7] AuthorŌĆÖs calculation comparing CCB students in Washington to national figures published by the National Student Clearinghouse detailed in note 1 earlier in this report.
[8] The Rural-Serving Institution index is a continuous metric ranging in values from ŌĆ£0ŌĆØ to ŌĆ£4.ŌĆØ Following the suggestion of using a value of 1.175 or higher to indicate a rural-serving institution, we categorize Yakima Valley College, Wenatchee Valley College, Lower Columbia College, Centralia College, Grays Harbor College, Peninsula College, Skagit Valley College, Bellingham Technical College, Whatcom Community College, and Big Bend Community College in this way.
[9] Percentages calculated by the author using the demographics table, looking at the annual head count of students enrolled in CCB programs.
[10] Employment and wage data were drawn from state unemployment insurance records for graduates working part time or full time. Graduates who are self employed or working for the military or federal government are not included.
Fellow, Community Colleges