A Chapter of: Living on Credit?
Borrowing Rates Over Time
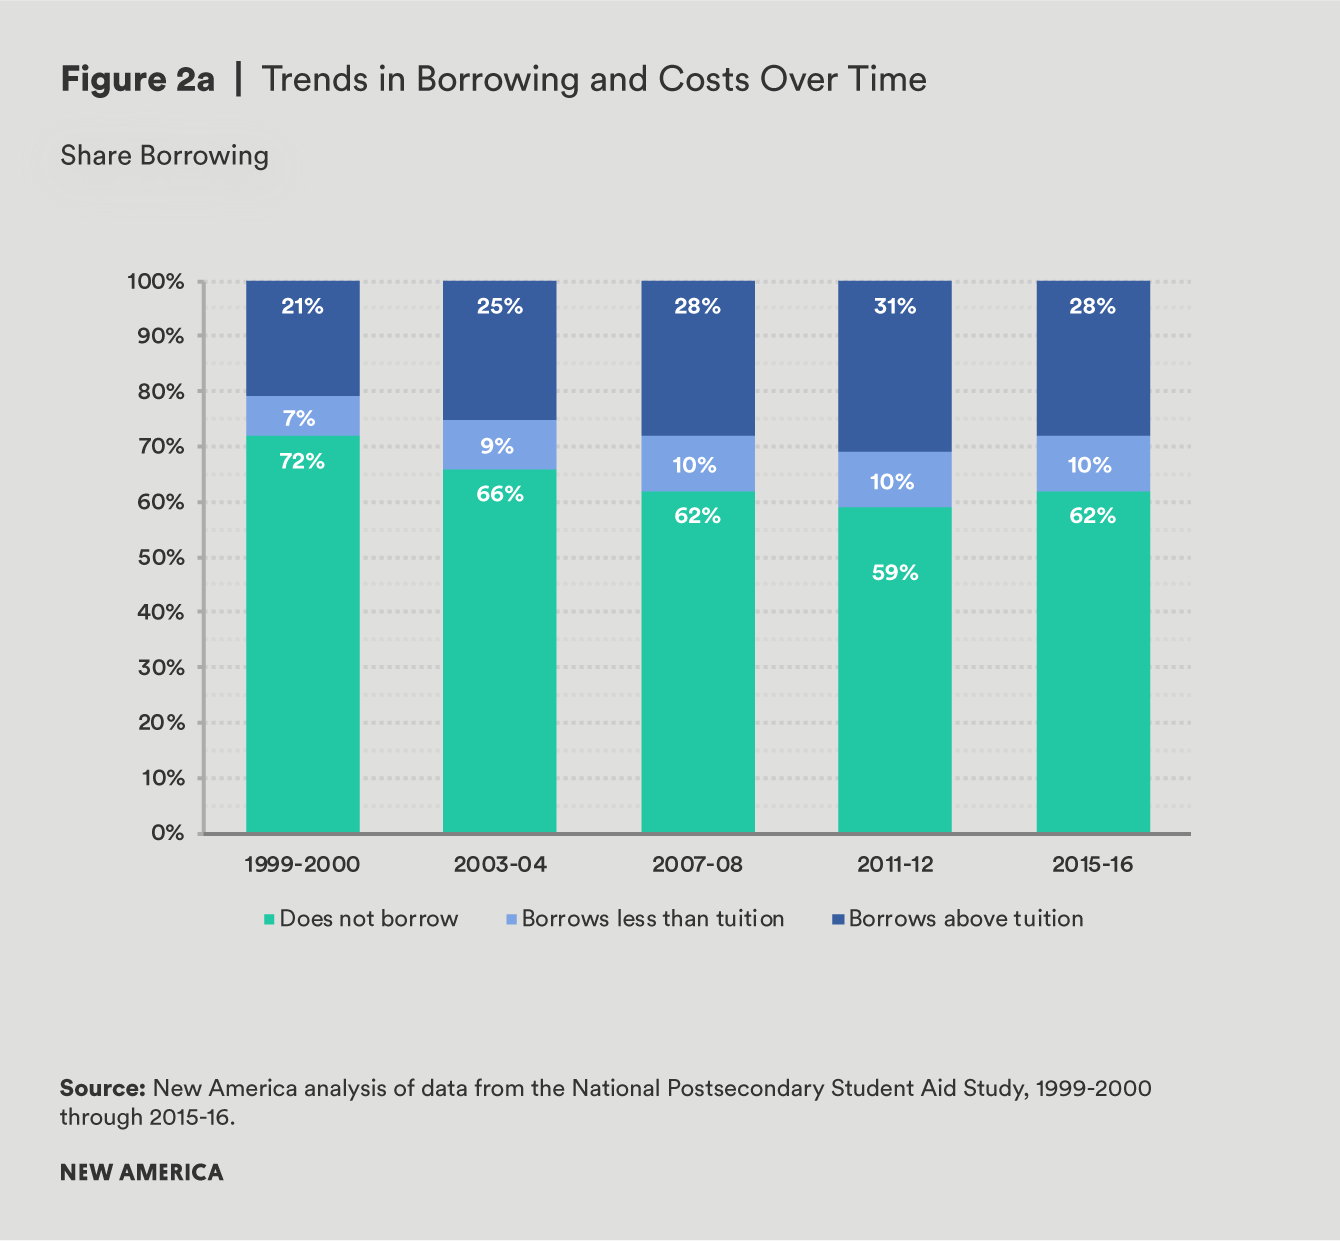
While the media often portray student debt as a near-universal experience, it is actually far from it. Just 38 percent of undergraduates took on any student debt during the 2015–16 school year: 10 percent of students borrowed below tuition costs, while 28 percent borrowed more than they paid in tuition and fees. However, many more students borrow today than in the past. In 1999–2000, only 28 percent of students borrowed, and 21 percent of undergraduates took on more than they paid in tuition and fees that same year.1
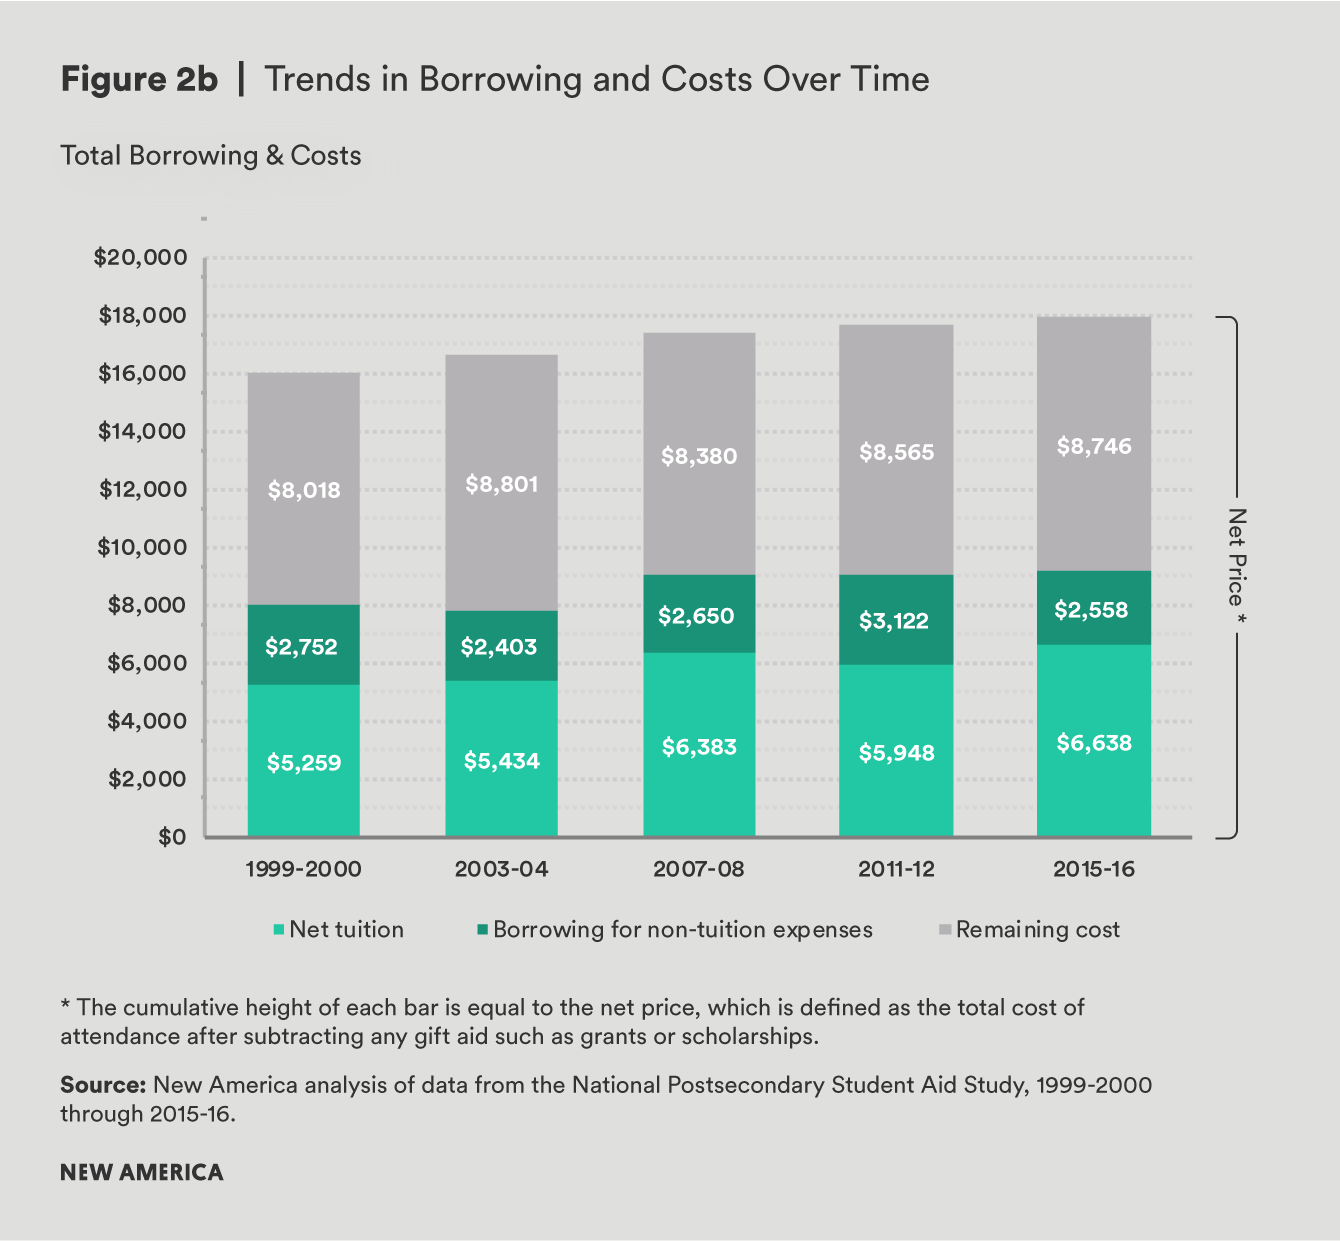
The typical undergraduate with debt now borrows, on average, $9,196 each year, including federal student loans, loans to parents, and other educational loan sources (see Figure 2). And even though undergraduate borrowing rates have increased significantly over the past 15 years, the amount of debt students take on has remained relatively flat after adjusting for inflation. This may be partially due to federal loan limits that have remain unchanged over that time and low utilization rates of private loans and loans to parents.2 The minimal growth in undergraduate student borrowing is made all the more surprising by the fact that the average net price, the amount students pay for tuition, has continued to tick up. In effect, the amount students borrow for their non-tuition costs has actually fallen over the last several years. The average borrower took out $2,558 more than the amount paid in tuition and fees in the 2015–16 school year, a figure that is about $800 less than the comparable amount in 1999–2000.
What are non-tuition expenses?
We use “non-tuition expenses” throughout this paper to refer to costs incurred by students such as housing and meals, transportation, books, personal expenses, and other miscellaneous items. While some non-tuition expenses may be more closely linked to a student’s educational experiences (such as books or a personal computer for completing assignments), research has shown that paying for basic needs like housing and meals is necessary for student success.3
The remainder of this analysis will delve into the amount students borrow across several characteristics. First, we explore how a student’s choice of institution and his or her family income relate to borrowing for non-tuition expenses, as well as how these two key factors interact. We then turn to an exploration of several other factors, including a student’s race, degree level, enrollment intensity, residency, and housing. Unless otherwise noted, all dollar amounts shown apply to the subset of undergraduates who borrow at least one dollar in student loans.

Citations
- Integrated Postsecondary Education Data System (IPEDS), Fall Enrollment Survey (IPEDS-EF: 95-99), National Center for Education Statistics, November 2017 and IPEDS Spring 2001 through Spring 2017, Fall Enrollment Component, National Center for Education Statistics, November 2017, .
- FinAid (website), “Historical Loan Limits,” .
- Benjamin M. Marx and Lesley J. Turner, Student Loan Nudges: Experimental Evidence on Borrowing and Educational Attainment (College Park, MD: University of Maryland, January 2018), .