A Chapter of: Mapping the Opioid Epidemic
Case Study: Cook County, Illinois

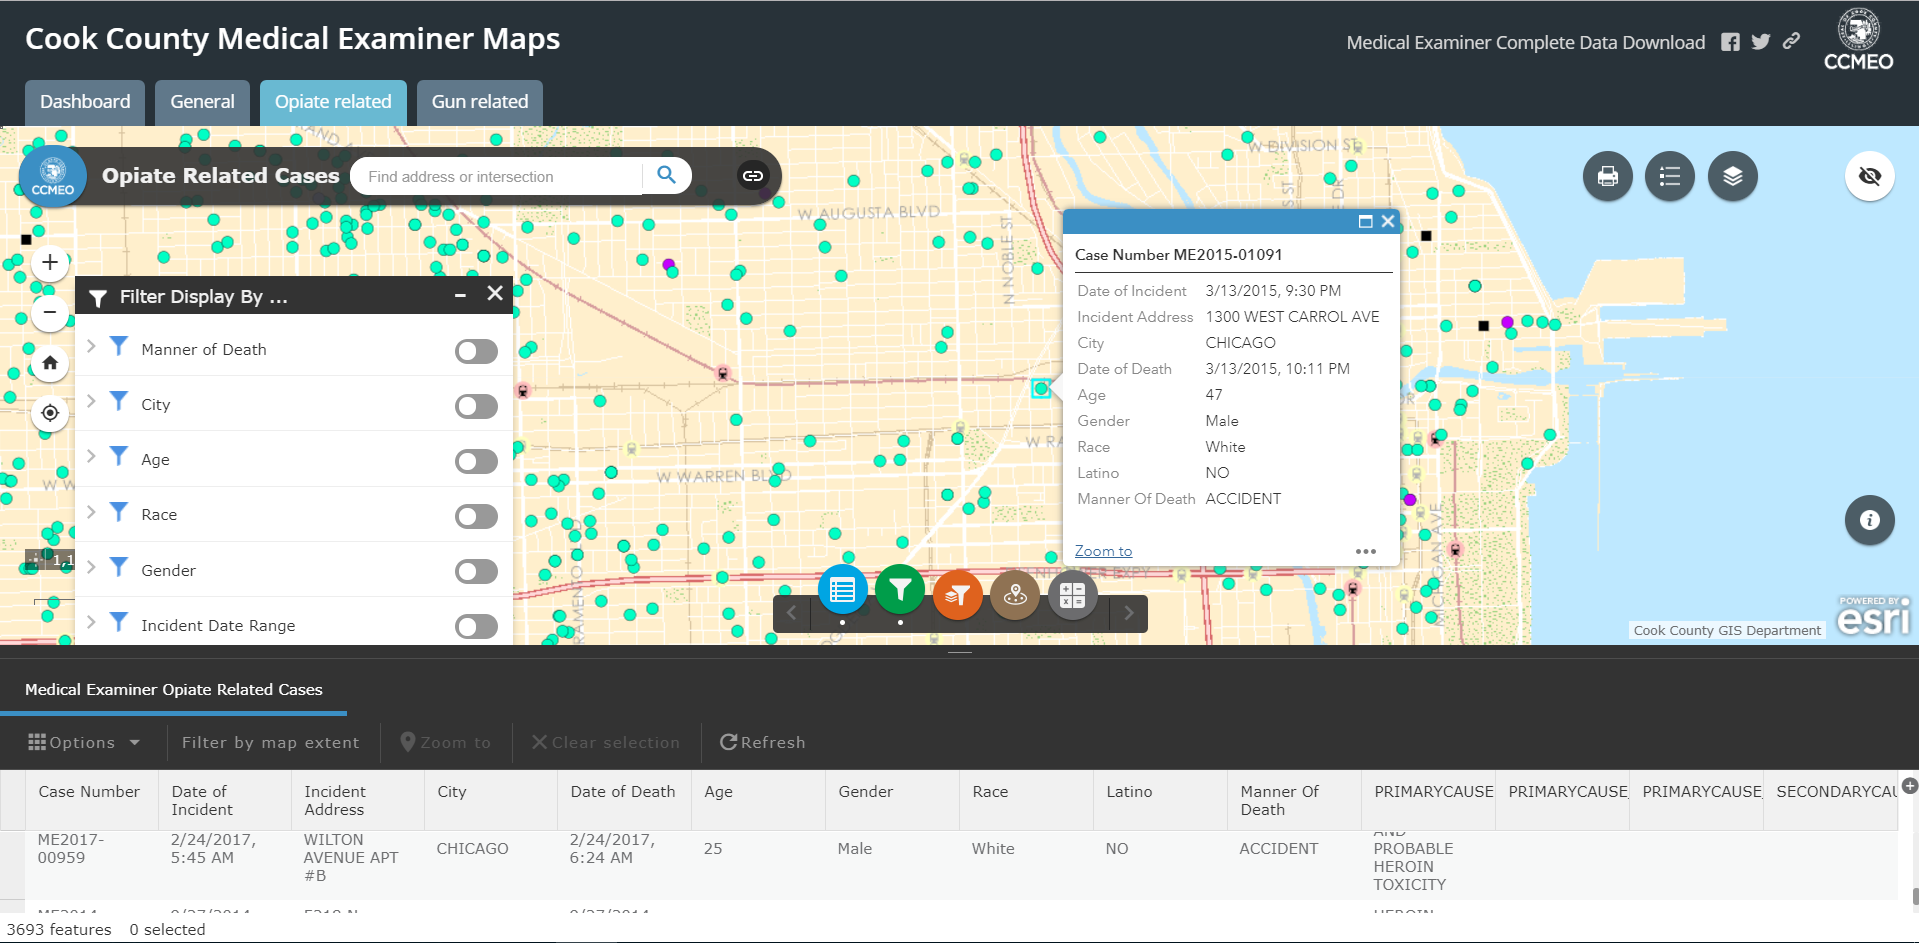
Local government workers in Cook County, Ill. used to spend a significant amount of time answering public records requests they received about opioid deaths. Because Cook County includes Chicago, the population is over 5 millionŌĆömeaning there was a lot of data to chart for requests. In order to provide information to law enforcement and the public, Cook County became the first county of its size to . It used to take hours, if not days, to pull this type of information for the DEA, local law enforcement, and the health department. But by incorporating data as it is reported each night into the map the following morning, their dashboard saves valuable time for public servants.
Cook County has also published , allowing anyone to embed it in applications or websites as they see fit.

Mapping the Opioid Epidemic
- Introduction
- National Naloxone Access Map
- National Prescription Drop-off Map
- Celebrating Lost Loved Ones Map
- Case Study: Northern Kentucky
- Case Study: Tri-County, Colorado
- Case Study: DuPage County, Illinois
- Case Study: Cook County, Illinois
- Case Study: Alameda County, California
- Case Study: Tempe, Arizona
- Case study: Northeastern University
- Getting Started With Local Opioid Work