A Chapter of: Mapping the Opioid Epidemic
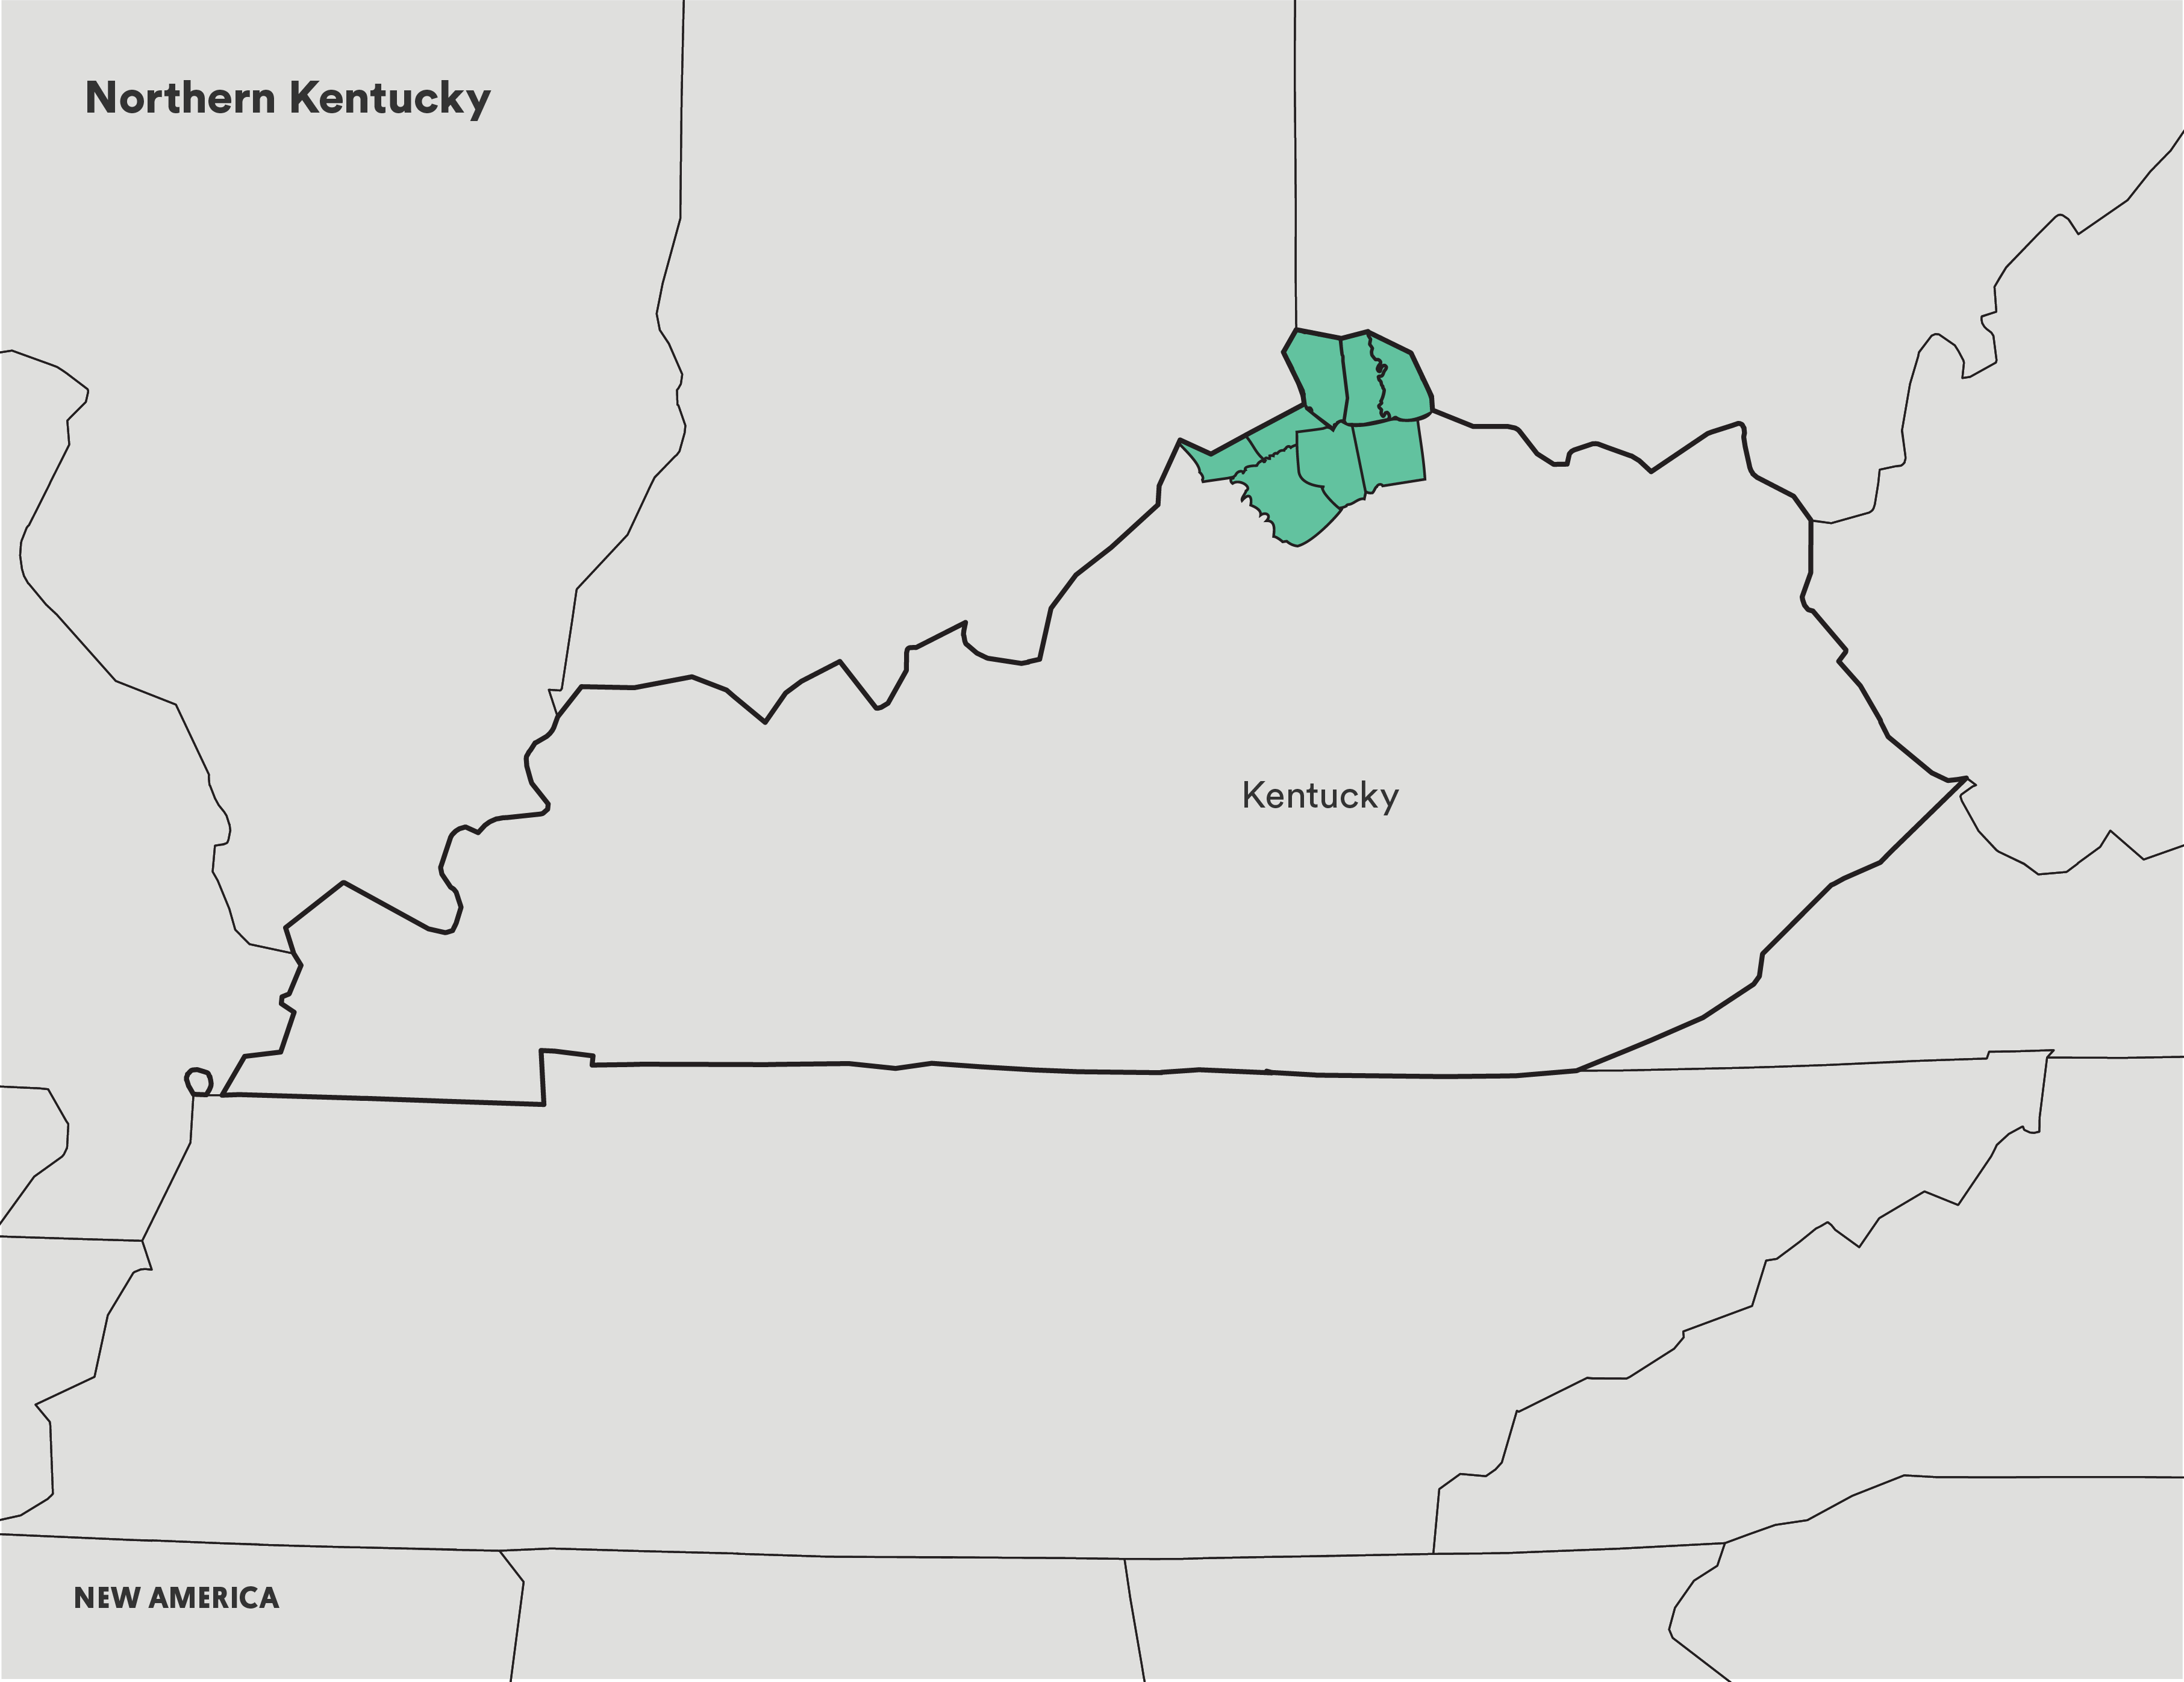
Case Study: Northern Kentucky
ÔÇ£The greatest impact of our work comes from showing the public that the problem is in their own backyard, and how they may be indirectly impacted without even knowing it through the allocation of tax dollars to fight the opioid epidemic.ÔÇØ
Ned Kalapasev, GIS Administrator, Northern Kentucky Health Department
In 2016, Kentucky was in the top 10 on the list of states with the . The Northern Kentucky Health Department and the countyÔÇÖs GIS team partnered to create a database for the . In doing so, they created the most comprehensive local-level compilation of opioid-related data in the country. Recorded in the database are datasets on overdose deaths, hospitalizations, heroine arrests, naloxone access locations, treatment centers, and prescription drop-off boxes.
This effort isnÔÇÖt just about one county, it represents the coordinated work of eight different counties and their corresponding governments. Residents in every one of these counties have up-to-date information on the state of the opioid epidemic and the community measures being taken to combat it.
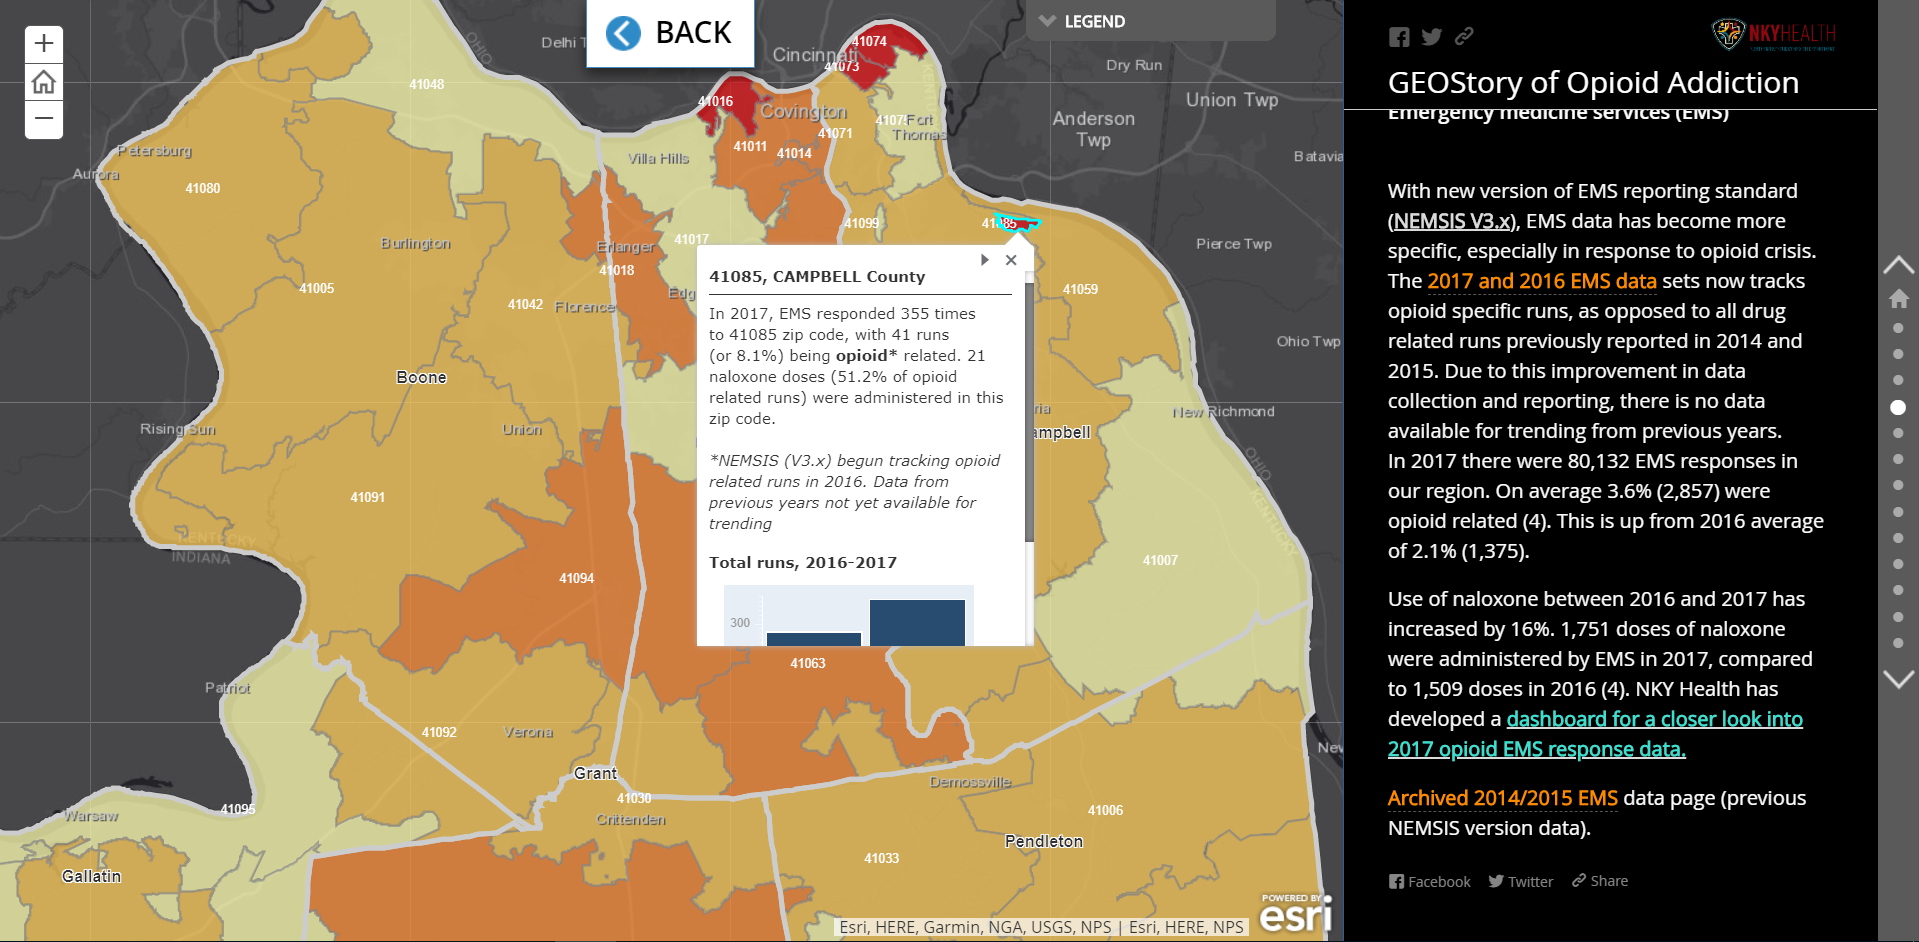
Northern Kentucky has also learned from other local governments through the Opioid Mapping Initiative. Following a presentation by Tempe, Ariz., on their work mapping EMS services, Northern Kentucky created a replica dashboard for their locality. tracks any opioid-related emergency dispatch, notes whether naloxone was used, and shows broader trends in patient age, gender, and the day of the week emergency services were utilized.
Northern KentuckyÔÇÖs opioid taskforce remains focused on public education as a critical component of their work. , which they created to impress the dire state of opioid overdoses in their counties, is open to the public and is regularly updated with new data.

Mapping the Opioid Epidemic
- Introduction
- National Naloxone Access Map
- National Prescription Drop-off Map
- Celebrating Lost Loved Ones Map
- Case Study: Northern Kentucky
- Case Study: Tri-County, Colorado
- Case Study: DuPage County, Illinois
- Case Study: Cook County, Illinois
- Case Study: Alameda County, California
- Case Study: Tempe, Arizona
- Case study: Northeastern University
- Getting Started With Local Opioid Work